Designing a customer reporting tool
BlueCat’s health check reports are important to customers, but generating them drained time, energy, and accuracy. Over three months, I led the design and research of a tool that automated this repetitive work, and delivered faster and more reliable results to clients.
Role
UX Designer, User Researcher
Client
BlueCat
Timeframe
3 months
Tools
Figma, Miro, Gong

Background
BlueCat serves Enterprise (ES) and Premier Support (PRS) customers, delivering proactive health check reports on their servers and databases. ES customers receive these reports quarterly, PRS twice a year.
The manual reporting process required agents to juggle multiple tools, spreadsheets, and scripts for each customer. Over three months, I collaborated with the Customer Care team, Product Owner, and Engineering to understand the process and design a solution that would make reporting efficient, accurate, and scalable.
Problem
The Customer Care team at BlueCat was spending over 2,000 hours a year manually preparing health check reports, copying data between multiple tools, spreadsheets, and scripts. This process was not only time-consuming but also error-prone and inconsistent across customers. The inefficiency created delivery delays, impacted data accuracy, and limited the team’s ability to focus on higher-value, proactive support work.
“How might we reduce the manual effort and inefficiency in the Customer Care team’s reporting process while improving accuracy and consistency for customers?”
The project was guided by three key drivers:
1
Automate and streamline the reporting process
2
Reclaim hundreds of wasted hours
3
Reduce errors to deliver more accurate reports
Process
Design research
Documentation review
Problem definition
User interviews
Synthesis
User journey map
User flows
Design Creation
User stories
Wireframes
Low & Mid-fi designs
Evaluation & Refinement
High fidelity designs
Interactive prototype
User validation
Initial research
To understand the full breadth of the problem, I began with a 58,000-word internal document that mapped every step of the reporting process. But documentation alone wasn’t enough. I reviewed existing customer calls, presentations, and facilitated interviews with internal stakeholders. I mapped the user journey and validated each step through daily sessions with the team.
The most important insight was the friction of assembling the reports and trusting the results. Reports weren’t difficult because information was missing; they were difficult because pulling it all together was manual and inconsistent. This shifted the project from “design a prettier report” to “design a seamless, automated workflow".

Ideation
With a better understanding of the problem, I explored different ways the tool could work. Early sketches and flow diagrams mapped out different approaches. I facilitated brainstorming sessions with the Customer Care team to capture their “dream” workflows, which helped prioritise features like customisation, visibility, and error detection. I also took note of different cases and created user stories and acceptance criteria for each point.
Through this process, I narrowed concepts down to one core direction: a guided reporting experience that would consolidate multiple tools into a single streamlined interface, balancing automation with flexibility.

User stories
I wrote persona-specific stories to define the needs of different users: regular vs. administrative users.
Regular User (Analyst): Creates and reviews automated health check reports to monitor system performance and share findings with customers.
User Story | Acceptance Criteria | Comment |
|---|---|---|
As a User, I want to log in to the AHC Application so that I can manage Health Check reports. |
| |
As a User, I want to see a warning message on the Login page so that I can be aware that my login was not successful | If users provide the wrong email address and/or password:
|
|
As a User, I want to log out of the AHC Application so that I can finish my activities on the application |
|
Admin User: Manages configurations, access permissions, and automation settings to ensure reporting accuracy and consistency across accounts.
User Story | Acceptance Criteria | Comment |
|---|---|---|
As an Admin User, I want to remove the details of already added clients so that I can delete them from the repository. |
| |
As an Admin User, I want to deactivate the already added users so that I can disable the user from accessing the AHC application. |
| soft removal → (marks them as inactive), after User removal, the historical reports generated by such Users are still available in the repository. |
As an Admin User, I want to add new users so that they can log into the AHC application. |
| The default password ahc123 is just an example, it can be whatever we decide in the implementation phase |
Design
I began mapping future workflows and translating them into bare-bone wireframes. The tool will allow Customer Care to select a customer, generate a report, and review the documents before delivery. Through research, I discovered that different "personas" or users have distinct needs: regular agents require a platform to create and monitor the status of their reports, while admins need a centralised location to monitor and manage everyone else.

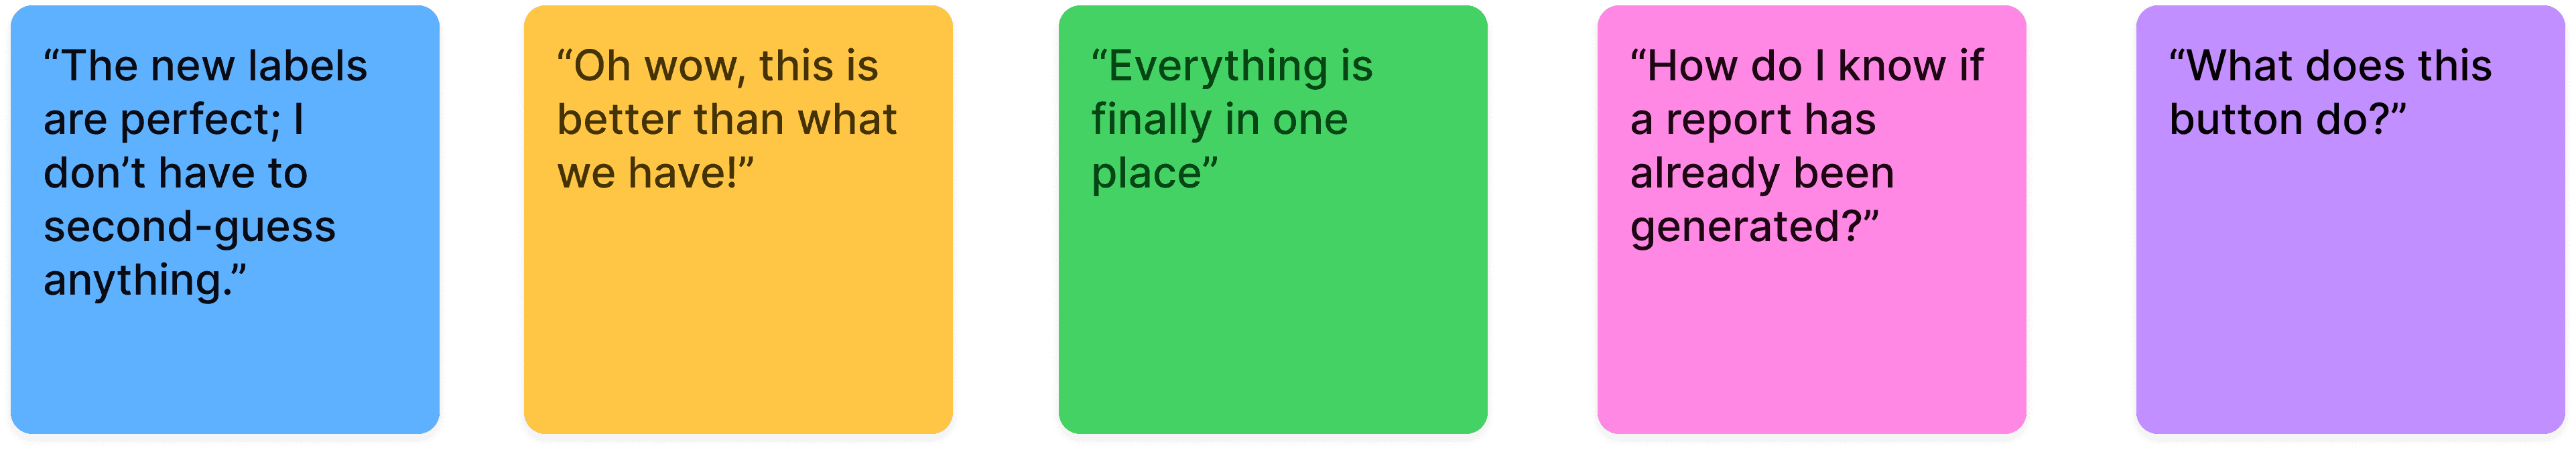
User Feedback & Iteration
Early mocks in Figma were shared directly with the Customer Care team. Their reactions made it clear we were on the right track. Their feedback also highlighted areas for refinement, such as simplifying navigation, clarifying terminology, and shortening steps. I iterated on these designs in close collaboration with engineering to ensure the final solution was both intuitive and technically feasible.
Error States: Designing for the Unexpected
It was important to me to define all potential error states early on while creating the user flows. I collaborated closely with engineers to identify not only user-facing errors but also backend-related issues that could arise during data processing or automation failures. This collaboration enabled me to design clear, context-specific responses for each scenario, ensuring the experience remained informative and consistent, even when things didn’t go as planned.

Results
The Automated Health Check tool I created completely transformed the process. What once took four hours per report now took minutes. The Customer Care team reclaimed over a thousand hours annually, the accuracy of these reports improved dramatically, and they could be delivered faster and with greater confidence.
For users, the change was immediate: no more juggling tools, no more endless copy-paste, no more doubt in the quality of their work. For the business, the impact went beyond time saved. The tool scaled with customer growth without the need for additional headcount and strengthened client trust by ensuring reports were reliable and delivered on time.
96%
reduction in report generation
Before
2000+ hours
(4 hrs/report)
After
<75 hours
(<30 mins/report)
Takeaways
Take time to understand the problem before designing
At the start, it was tempting to jump straight into solutions. but spending time dissecting the 58,000-word process document, talking to users, and mapping pain points proved invaluable. That deep understanding made every design decision more intentional and prevented wasted effort on surface-level fixes.
Don’t underestimate the value of proximity to users
While I spent significant time with stakeholder documentation, direct conversations with the Customer Care team offered insights that no document could. Hearing firsthand how they navigated pain points clarified priorities and helped shape a more intuitive flow. The experience reinforced the importance of balancing desk research with direct user engagement.
Cross-functional collaboration drives smarter solutions
This project showed how deeply collaboration influences the quality of outcomes. Partnering closely with engineers and product managers ensured that design decisions were technically sound and scalable. Those constant touchpoints built alignment, improved feasibility, and ultimately made the solution stronger

.